Serendip is an independent site partnering with faculty at multiple colleges and universities around the world. Happy exploring!

Remote Ready Biology Learning Activities

Remote Ready Biology Learning Activities has 50 remote-ready activities, which work for either your classroom or remote teaching.

Thinking About Segregation and Integration
An Interactive Scientific Exploration Using Models

A Basic Model

Introduction Implications Exploration Tips An Advanced Model References


Understanding the Model

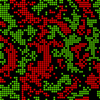
1. Locations in a two dimensional grid can be occupied by two differing sorts of entities, one green and the other red.

2. Each location has eight neighbors (edge locations have neighbors on the other side's edge) and each type of entity has a controllable preference to be surrounded by neighbors like (or different from) themselves. The preference is expressed by a wish to have some particular percentage of the eight neighbors of any entity to be like (or different) from the entity itself.

3. At each time step (iteration) of the model, entities check the relevant percentage of their eight neighbors.

4. If the preference is greater than the preference value, the entities remain where they are. If it is less than the preference value, they move randomly to any open location.

5. The model continues running until no one moves on successive iterations.

The basic model will let you:

  • start with either an integrated (random) or a segregated distribution of reds and greens,
  • control the population size (and hence density),
  • control the strength of preference, and
  • select the direction of preference (similar or different).

See what you discover!

Download the NetLogo Model

Download Page for NetLogo at Northwestern University

Launch the Model in a Browser
(will open in a second window) - no longer recommended


Some Tips for Your First Experiment

1. Select a number of entities using the top slider (1400 is a good starting number). Half of them will be green and half red.

2. Click on "setup with random distribution" to get an integrated starting point (you can try "setup with segregated distribution" later).

3. Set the "strength-of preference" using the second slider (50% is a good starting point; it means the entities are comfortable and will stay put if 50% or more of their neighbors are similar to them, or, to put it differently, they will stay put unless more than 50 % of their neighbors are different from them).

4. Leave "preference" as "prefers-similarity" (you can change this later too).

5. Click "go" ... and watch what happens. The two little yellow windows will show you changing values of the average number of similar neighbors and the number of entities that want to move because they don't have enough similar neighbors of the kind they prefer. The lower yellow windows will give you a plot of how these values change over time. Try it, keep an eye on the world and the values, and then, if you like, read on


Interpreting and Refining Your Results

So, did you see an integrated distribution turn into a segregated one? Were you surprised? Schelling certainly was, and most people are when they see the model for the first time. What it indicates is that a VERY mild preference for having similar people around one is enough in this situation to result in segregation. Notice that a 50% preference means that everyone would in fact be content in an integrated environment, but because unhappy people move randomly, a segregated environment results nonetheless.

Does that ALWAYS happen, or does it depend on the starting distribution? Try it again and see. As many times as you need to to get an answer that satisfies you.

What happens if you make the preference for similarity even less? Try a range of values (be sure to do each several times) and plot the resulting percent similar as a function of preference. Add some preference values above 50% and plot those too. Is it a simple relationship? Are you surprised? Why is the relationship the way it is?

Now, Try a "Different" Experiment

It looks like its surprisingly hard to get an integrated environment by reducing peoples' preferences to be around people like themselves. Frustrating perhaps, if one thinks integration is a good thing. Is there any OTHER way to get integration? Try "setup with a segregated distribution" and changing preference to "prefers difference" (click and hold on the red triangle and select appropriately from the drop-down menu). Is that interesting? Try varying "strength-of-preference" with those settings.

When you've got some feeling for how the model behaves for a given population size/density, you can try varying that and see how it affects the conclusions you might reach. And if all this makes you wonder about some other things that might influence what happens, you can go on to the Advanced Model.


This model was written by Ann Dixon and Paul Grobstein, with input from Doug Blank and Ted Wong, and is a project of the Emergent Systems Working Group of the Center for Science in Society at Bryn Mawr Colllege. The model was created and translated into java applets using NetLogo software made available by the Center for Connected Learning, and is a modification of:

Wilensky, U. (1998). NetLogo Segregation model. http://ccl.northwestern.edu/netlogo/models/Segregation. Center for Connected Learning and Computer-Based Modeling, Northwestern University, Evanston, IL.

created with NetLogo

view/download model file: SerendipSegregation.nlogo


| Forum | Complex Systems | Serendip Home |

Send us your comments at Serendip

© by Serendip 1994- - Last Modified: Wednesday, 02-May-2018 10:51:07 CDT