Proposal
Diabetics and the Workplace
Holly Stewart
The purpose of this research is to
examine the factors in the social environment that are
responsible for influencing blood glucose levels in
Type 1 Diabetics. This project is in response to discrepancies
in the literature about how activity, stress and working
environment alter blood glucose levels. The specific
focus will be to examine how diabetics respond to the
stress and conditions of their working environment,
for example, working outside may be just as stressful
as working inside, but may involve a different type
of physical activity. The literature states that being
outside reduces blood glucose levels because activity
makes insulin more efficient, yet, there is some difficulty
in also accounting for the influence of stress. In this
research I would like to examine what types of patterns
are present in diabetics and also examine the overall
range of blood glucose depending on environmental factors.
There may be more complicated circumstances that influence
blood glucose than have been recognized in the past.
This project will be executed using
three groups: two control groups and one transitional
group. One of the control groups will be an indoor group:
those diabetics who work mainly indoors but still maintaining
and active lifestyle. The second control group will
be diabetics that work primarily outside. The assumption
is that regardless of whether you work inside or outside
there is stress associated with your job, but that over
time you are able to compensate for possible stress
from the working environment by adjusting insulin levels.
Each control group would have a minimum of ten people.
The third group is the transitional group. This group
would consist of fifteen to twenty diabetics who initially
are in an indoor workplace and transition to an outdoor
workplace. The transition will be from an indoor workplace
to an outdoor diabetes camp. These diabetics will monitor
their blood sugars five weeks before going to camp and
five weeks through camp. Arguably the stress and demands
of being a camp counselor are similar to those of school
or an office job.
At the beginning of the experiment
standards would be taken in the areas of age, height,
weight, amount of insulin (basal levels, bolus ratios),
injection method (pump, syringes), type of insulin (long-lasting,
short-lasting), years with diabetes, complications,
starting glycated hemoglobin (A1C) level, and blood
glucose meter type. Participants in the study would
be expected to test blood glucose levels at 12am, 2am
(if awake), 8am, 12pm, 3pm, 6pm and 9pm (± no
more than one hour). A1C blood draws will occur for
the controls at the beginning and end of the study and
for the transitional group at the beginning, half-way
and at the end of the study. In weeks 2, 6, and 10,
the participants in the transitional group will be required
to do basal checks of their insulin levels over a period
of one week, checking in four hour blocks of time. Participants
will be required to document their blood glucose, note
activity (time and location), when insulin given and
any changes to their routine. The goal is to look for
not only changes in blood glucose numbers in general,
but also look at the range of blood glucose, the percentage
of high and low blood glucose and how that changes.
Summary
An Analysis of Blood Glucose
Patterns and Effects on Blood Glucose Values
and Glycated
Hemoglobin Levels in Type 1 Diabetics due to
Changes in the Level of Activity in the Work Environment
By Holly L. Stewart, Bryn Mawr College;
Mentored by Janet Kramschuster, CTRS, Diabetic Youth
Foundation
Objectives: The goal
of this experiment was to understand the effect on blood
glucose from changes in the level of activity in the
work environment in Type 1 Diabetics; and to identify
patterns in blood glucose which result from these changes
in activity.
Introduction:
Diabetes mellitus: Type 1 is an autoimmune disease affecting
the beta cells of the pancreas, rendering them unable
to produce insulin which is needed in order to metabolically
process glucose. The regulation of blood glucose levels
is complex and not yet well understood. However, it
is well know exercise has positive effects on blood
glucose control by creating greater insulin sensitivity.
Previous research has identified that an increase in
activity for Type 1 Diabetics leads to better metabolic
control and lipid profile. Despite the positive effects
of exercise on blood glucose control however, the specific
effects of exercise on insulin sensitivity are not well
understood and tend to be extremely variant depending
on the individual. This inconsistency in being unable
to predict how blood glucose levels fluctuate due to
changing levels of activity makes it difficult to maintain
target range of blood glucose levels between 80 and
150 mg/dl. Because of this individual variation, little
research has been designated toward attempting to find
commonalities and patterns for Diabetics, since many
factors (including exercise, stress and food) can account
for changes in blood glucose levels.
This research was aimed to explore the
effect of exercise on blood sugar and investigate whether
consistent blood glucose patterns existed among diabetics
with very different self-management philosophies. This
research attempted to primarily examine the overall
as well as the daily patterns of blood glucose values,
with a secondary focus on examining the psychological
impacts which result from such a study. It was apparent
that an increase in exercise itself had a significant
yet extremely complex effect on the regulation of blood
glucose values. Additionally the psychological effects
of logging blood glucose values provided inspiration
for further research as well as further examination
of the medical strategies presented to young-adult Type
1 Diabetics today.
Methods:
Over a twelve week period this research examined the
patterns of blood glucose in three groups of Type 1
Diabetics, ages 18 to 30, distinguished by their levels
of activity. There were two control groups, one sedentary
(less than 3 hours of activity per week) group and one
active (more than 6 hours per week of intensive activity)
group. The third group was composed of fourteen diabetics
who were in a transitory state of activity. Having monitored
this group for two to four weeks in a sedentary lifestyle
they were than placed in an environment where their
activity increased to over eight hours per day. The
changes in blood glucose patterns, insulin sensitivity
and glycated hemoglobin (hA1C, A1C) levels were monitored
for the remainder of the study.
Those individuals in the transitory group
were required to check their blood glucose levels a
minimum of six times per day, including prior to meals.
In addition to checking blood glucose levels, participants
were required to keep a log of their blood glucose levels
and carbohydrate intake, noting any changes in insulin
dosages due to activity. Glycated hemoglobin levels
were taken during Week One, Week Five and Six, and Week
Ten of the research. Surveys were conducted at the beginning
and the end of the study to evaluate the effects on
logging blood glucose as well as discussing the changes
in insulin sensitivity and control due to the change
in activity.
Results:
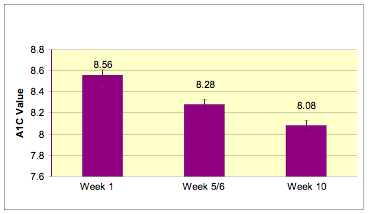
Final A1C values taken at Week Ten demonstrated a significant
decrease (p<0.01) as compared with initial A1C values
taken during Week One (Figure 1)

Figure 1: Comparison of A1C values at Week 1, Weeks
5 and 6, and Week 10 (n=14). Data is represented as
mean values ± SEM.
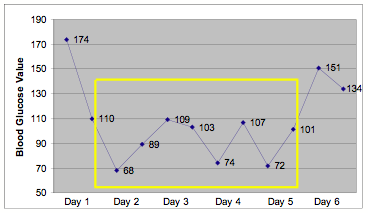
Two distinct patterns regarding blood glucose were
discovered in the data for the transition week to a
more active environment. During the transition week
blood glucose readings for Days 2-5 revealed a significant
(p<0.01) pattern of hypoglycemia (Figure 2).

Figure 2: Pattern of blood glucose values
(mg/dl) for days 1-6 during transition week. Data reports
average values at 12am and 12pm. Box indicates significant
pattern of hypoglycemia (n=5).
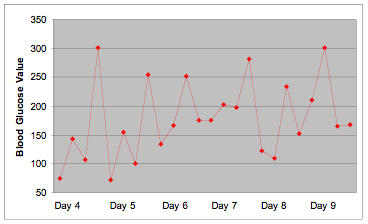
The second distinct pattern demonstrated
extreme fluctuations in blood glucose values. This pattern
of fluctuation was only apparent in Days 4-9 and no
other block of time showed significant changes in blood
glucose values (Figure 3).

Figure 3: Pattern of blood glucose values
(mg/dl) for Days 4-9 of the transition week. Data points
represent blood glucose readings at 12am, 8am, 12pm
and 6pm, respectively. (n=6)
Over the course of the study, there was
a significant (p< 0.01) increase in hypoglycemic
blood glucose values between the hours of 10pm and 6am
(Table 1).
Week
|
Percent
Night Lows |
Number |
1 |
14% |
2 |
2 |
7% |
1 |
3* |
92% |
13 |
4 |
78% |
11 |
5 |
85% |
12 |
6 |
64% |
9 |
7 |
50% |
7 |
8 |
50% |
7 |
9 |
42% |
6 |
10 |
57% |
8 |
Table 1: Comparison of percentage of
hypoglycemia readings between 10pm and 6am (n=14).
*Indicates transition week.
Discussion and Conclusions:
The results from
this research illustrate that an increase in activity
has a diverse and significant effect on blood glucose
levels in Type 1 Diabetics. An overall decrease in
A1C levels suggests that regular physical activity
over an extended period of time is an effective way
to lower glycated hemoglobin levels. This control
over blood glucose values is extremely important for
avoiding the late-onset complications of uncontrolled
diabetes; however it is still unclear just how exercise
alone improves the chances of avoiding such complications.
The decrease in average A1C levels over the course
of the ten weeks also may be due to the impact of
logging blood glucose values and having regular A1C
readings. This conclusion is supported by the literature
produced by Farmer, AJ et al. who found that consistent
and “real-time” feedback of information
about blood glucose levels significantly improved
glycemic control. Although the daily effects of exercise
may be complicated, the overall trend of a higher
percentage of target range numbers (as demonstrated
by lower A1C levels) due to an increase in activity
is an important factor in control of Type 1 Diabetes.
The two blood glucose patterns identified
were helpful to better understand the ways in which
an increase in activity can affect blood glucose values.
Although not every individual’s data followed
these patterns, it was encouraging to find that there
are basic patterns of blood glucose change which may
occur in correlation with an increase in physical
activity. Virtually no literature exists describing
the existence of such patterns in Type 1 Diabetics,
simply because the research is complicated and the
results are inconsistent. The specific trends of intense
low blood glucose readings from Days 2-5 of the transition
week may be complicated by such factors as stress
and adrenaline. Further research would need to be
done to better understand the body’s response
to such an immediate and drastic increase in exercise,
and this trend may simply be representative of the
body’s response to such an increase. The second
pattern found demonstrating extreme fluctuations is
interesting because this is indicating the body may
be struggling to adapt and an increase in insulin
sensitivity may take time. Further research would
need to investigate the time it takes for the body’s
sensitivity to insulin to increase and further control
would be needed on such other factors such as stress
and carbohydrate intake.
The significant increase in the amount
of nighttime hypoglycemic blood glucose levels supports
what is found in the literature. McMahon SK, et al.
found moderate-intensity afternoon exercise created
a delayed risk for nighttime hypoglycemia. Participants
responded to these nighttime hypoglycemic episodes
by decreasing their overall daily intake of insulin.
Over the course of the study each participant’s
sensitivity to insulin increased. The change in sensitivity
varied, ranging from a one-third to three-quarters
reduction in daily totals of insulin at the end of
the study as compared with the beginning. Since exercise
make insulin more efficient it is consistent to conclude
that an increase in physical activity is responsible
for this change. It would be interesting to have a
follow-up study to examine as participants’
lifestyles changed back into more sedentary settings
whether insulin sensitivity remained the same and
if it changed, it would be interesting to investigate
how long it took for this change to occur.
One of the most interesting aspects
of this research was the psychological effects as
demonstrated through subjective surveys at the beginning
and end of the research period. Participants reported
a change in the way they thought about their blood
glucose values, reporting at the end of the study
they were much more conscious about how they felt
when they were hyper- or hypoglycemic. It was also
interesting to hear participants discuss the effects
of logging their blood glucose values. All the participants
reported a change in attitude toward their blood glucose
readings which they self-reported as being because
they were logging their values and were better able
to see trends in their numbers. The act of writing
it down for a number of the participants became a
motivator for attempting to remain in tighter control
and checking blood glucose values more often. This
psychological aspect of recording blood glucose levels
could significantly impact the way Type 1 Diabetics
manage their Diabetes. Further research would be necessary
to confirm that logging blood glucose values not only
has a psychological impact but furthermore encourage
better blood glucose control, however this research
has served as a jumping point for further research
into this area.
Realistically there are a number of
factors which could not be controlled for in this
experiment. Stress and the effect of stress on blood
glucose values is something which cannot easily be
accounted for. It is also pertinent to note that the
transition group was isolated to one location at a
summer camp for diabetics and the psychological effects
of being in an environment surrounded by the support
of other Type 1 Diabetics was not accounted for either.
Food and carbohydrate intake was not controlled and
some variations in blood glucose levels could have
been due to changes in food or the type of food being
consumed at any given meal. Despite all of these potential
sources of complication, this research demonstrates
the varying and complex effects of exercise on blood
glucose levels and prompts further research into other
factors in the environment which may affect blood
glucose values also.
References:
World
Health Organization Department of Noncommunicable
Disease Surveillance (1999). Definition, Diagnosis
and Classification of Diabetes Mellitus and its Complications.
Rybka J. “Development
of opinions on physical exercise for diabetics.”
Valerio
G, Spagnuolo MI, Lombardi F, Spadaro R, Siano M, Franzese
A. “"Physical
activity and sports participation in children and
adolescents with type 1 diabetes mellitus."”
Schneider
S, Iannotti RJ, Nansel
TR, Haynie
DL, Simons-Morton
B, Sobel
DO, Zeitzoff
L, Clark
L, Plotnick
LP. "Identification
of distinct self-management styles of adolescents
with type 1 diabetes."”
Salvatoni
A, Cardani
R, Biasoli
R, Salmaso
M, De
Paoli A, Nespoli
L. “Physical
activity and diabetes.”
Farmer
AJ, Gibson
OJ, Dudley
C, Bryden
K, Hayton
PM, Tarassenko
L, Neil
A. “"A
randomized controlled trial of the effect of real-time
telemedicine support on glycemic control in young
adults with type 1 diabetes."
McMahon
SK, Ferreira
LD, Ratnam
N, Davey
RJ, Youngs
LM, Davis
EA, Fournier
PA, Jones
TW. “"Glucose
requirements
to maintain euglycemia after moderate-intensity afternoon
exercise in adolescents with type 1 diabetes are increased
in a biphasic manner."
My deepest thanks
to Janet Kramschuster and Bearskin Meadow Camp for
all their help this summer in this research.
Thanks also to the John Muir Medical
Network and to Dr. Mary Simon, in her help and guidance
in understanding Diabetes and the endocrine system.
Thanks also to Bryn Mawr College and for all the friends,
family, nurses and staff who made this research interesting
and possible.
|

