
Serendip is an independent site partnering with faculty at multiple colleges and universities around the world. Happy exploring!
Understanding and Predicting Changes in Population Size – Exponential and Logistic Population Growth Models vs. Complex Reality
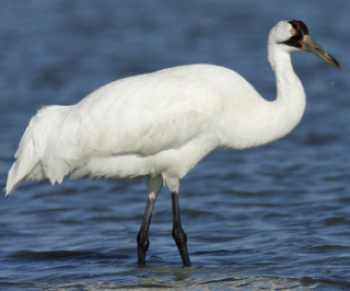
In this analysis and discussion activity, students develop their understanding of the exponential and logistic population growth models by analyzing the recovery of endangered species and growth of bacterial populations.
Students learn about the processes that cause exponential or logistic population growth, interpret data from several investigations, and apply their understanding to policy questions.
Next, students analyze examples where the trends in population size do not match the predictions of the exponential or logistic population growth models. They learn that models are based on simplifying assumptions and a model’s predictions are only accurate when the simplifying assumptions are true for the population studied.
In the last section, students analyze trends in the number of people on the earth and analyze one of the factors that affect the earth’s carrying capacity for people.
One version of the Student Handout includes mathematical equations, which are omitted from the other version. These versions of the Student Handout will be suitable for most high school students. I have also prepared a simpler Student Handout, which will be suitable for most middle school students.This simpler version is called “Population Growth – Effects of the Environment” (https://serendipstudio.org/exchange/bioactivities/popgr).
The first two attached files have the version of the Student Handout that includes mathematical equations for the exponential and logistic models of population growth. The third and fourth attached files have the version of the Student Handout without mathematical equations. The fifth and sixth attached files have the Teacher Notes for this activity. The Teacher Notes provide background information and instructional suggestions and explain how this activity is aligned with the Next Generation Science Standards and the Common Core State Standards.
| Attachment | Size |
|---|---|
| PopGrowthMathSH.docx | 1.65 MB |
| PopGrowthMathSH.pdf | 643.92 KB |
| PopGrowthBioSH.docx | 1.64 MB |
| PopGrowthBioSH.pdf | 636.5 KB |
| PopGrowthTN.docx | 2.63 MB |
| PopGrowthTN.pdf | 1.32 MB |

Download Minds-On Activities for Teaching Biology
Introduction and Activities Listing

Intro and Biological Molecules
- Characteristics of Life
- Levels of Organization in Biology (NGSS)
- Introduction to Proteins and DNA (NGSS)
- Enzymes Help Us Digest Food (NGSS; hands-on)
- A Scientific Investigation – What types of food contain starch and protein? (NGSS; hands-on)
- Coronaviruses – Introduction (NGSS)
- Who Took Jerell’s iPod? -- An Organic Compound Mystery (hands-on)
- Is Yeast Alive? (hands-on)
- Macromolecules Jeopardy

Cell Structure and Function
- Cell Structure and Function – Major Concepts and Learning Activities
- Cells – How do they carry out the activities of life? (NGSS)
- Why do some plants grow in odd shapes? (NGSS)
- Introduction to Osmosis (NGSS; hands-on)
- Cell Membrane Structure and Function (NGSS; hands-on)
- Cell Vocabulary Review Game

Cellular Respiration and Photosynthesis
- Cellular Respiration and Photosynthesis - Key Concepts and Activities
- How do organisms use energy? (NGSS)
- Using Models to Understand Cellular Respiration (NGSS)
- Using Models to Understand Photosynthesis (NGSS)
- Photosynthesis, Cellular Respiration and Plant Growth (NGSS; hands-on)
- Food, Physical Activity, and Body Weight (NGSS)
- How do muscles get the energy they need for athletic activity? (NGSS)
- Alcoholic Fermentation in Yeast – A Bioengineering Design Challenge (NGSS; hands-on)
- Plant Growth Puzzle (NGSS)
- Where does a tree’s mass come from? (NGSS)
- Photosynthesis Investigation (NGSS; hands-on)

Cell Division
- Mitosis and the Cell Cycle (NGSS; hands-on)
- Mitosis and the Cell Cycle (NGSS)
- Meiosis and Fertilization – Understanding How Genes Are Inherited (NGSS; hands-on)
- Understanding How Genes are Inherited via Meiosis and Fertilization (NGSS)
- Meiosis and Fertilization Produce Genetic Diversity (NGSS)
- Comparing Mitosis and Meiosis
- What causes melanoma and other types of cancer? (NGSS)
- Mistakes in Meiosis – Down Syndrome or Embryo Death (NGSS)
- Mitosis, Meiosis and Fertilization Vocabulary Review Game

Genetics
- Genetics Concepts and Activities (NGSS)
- Genetics (NGSS; hands-on)
- Genetics Intro – Family Members (NGSS)
- Genetics Sickle Cell Anemia and Trait (NGSS)
- Genetics Probability – Sex Ratios (NGSS)
- Mistake in copying DNA & Dwarfism (NGSS)
- Soap Opera Genetics (NGSS)
- Were the babies switched? The Genetics of Blood Types (NGSS; hands-on)
- Dragon Genetics I (hands-on)
- Dragon Genetics II (hands-on)
- Learning about Genetic Disorders
- Genetics Vocabulary Review Game
- Genetics Jeopardy

Molecular Biology
- Molecular Biology: Major Concepts and Learning Activities (NGSS)
- DNA (NGSS; hands-on)
- DNA Function, Structure and Replication (NGSS)
- How Genes Can Cause Disease - Introduction to Transcription and Translation (NGSS; hands-on)
- How Genes Can Cause Disease - Understanding Transcription and Translation (NGSS)
- UV, Mutations and DNA Repair (NGSS; hands-on)
- What types of mutations cause more vs. less severe muscular dystrophy? (NGSS)
- Making Red Blood Cells (NGSS)
- Genetic Engineering Challenge – Preventing Vitamin A Deficiency (NGSS)
- Gene Editing with CRISPR-Cas – Potential Sickle Cell Anemia Cure (NGSS)
- Molecular Biology Vocabulary Review Game

Evolution
- Resources for Teaching and Learning about Evolution
- Evolution by Natural Selection (NGSS; hands-on)
- What is natural selection? (NGSS)
- Natural Selection and the Peppered Moth (NGSS)
- How have mutations and natural selection affected fur color in mice? (NGSS)
- How Whales Evolved (NGSS)
- How Eyes Evolved – Analyzing the Evidence (NGSS)
- How does evolution result in similarities and differences? (NGSS; hands-on)
- What is a species? (NGSS)
- Coronavirus Evolution and the COVID-19 Pandemic (NGSS)
- How Animals Adapt to Their Environments – Examples and Evolution (NGSS)
Ecology
- Ecology Concepts and Learning Activities (NGSS)
- Population Growth (NGSS)
- Exponential and Logistic Population Growth Models vs. Complex Reality (NGSS)
- Some Similarities between the Spread of Infectious Disease and Population Growth (NGSS; hands-on)
- Stability and Change in Biological Communities (NGSS)
- Food Webs, Energy Flow, Carbon Cycle and Trophic Pyramids (NGSS)
- Food Webs (NGSS)
- Carbon Cycles and Energy Flow through Ecosystems (NGSS)
- Trophic Pyramids (NGSS)
- Ecosystem Services (NGSS)
- Introduction to Global Warming (NGSS)
- Food and Climate Change – How can we feed a growing world population without increasing global warming? (NGSS)
- Coral Bleaching (NGSS)
- Resources for Teaching about Climate Change
- The Ecology of Lyme Disease (NGSS)

Human Physiology and Health
- Negative Feedback, Homeostasis, and Positive Feedback, with Breathing Experiment (NGSS; hands-on)
- Homeostasis, Negative Feedback, and Positive Feedback (NGSS)
- How do food molecules reach our muscles? (NGSS)
- How do we Sense the Flavors of Food? (NGSS; hands-on)
- COVID-19 Vaccines (NGSS)
- Molecular and Evolutionary Biology of HIV/AIDS and Treatment (NGSS)
- Resources for Teaching Cancer Biology
- Carbohydrate Consumption, Athletics, Health – Using Science Process Skills
- Vitamins and Health – Why Experts Disagree
- Regulation of Human Heart Rate (hands-on)
- Should You Drink Sports Drinks? When? Why?
Subscribe
Subscribe to our listserv to receive notices when we post new activities or significant revisions or when we offer an online professional development.
Creative Commons License
This work is licensed under a Creative Commons Attribution-NonCommercial 4.0 International License. To preserve the value of these learning activities for other teachers, please do not post keys for any questions from any of these activities!

Authors
Remote Ready Biology Learning Activities
Remote Ready Biology Learning Activities has 50 remote-ready activities, which work for either your classroom or remote teaching.
What's New? Subscribe to Serendip Studio
A Random Walk
New Topics
-
2 days 7 hours ago
-
2 days 7 hours ago
-
2 days 7 hours ago
-
2 days 7 hours ago
-
5 days 6 hours ago

Comments
2025 Revision
Questions have been added to the Student Handout for improved student comprehension, and other questions have been rephrased for greater clarity. The Teacher Notes have been updated with more recent sources.
Ingrid
2023 revision
I have updated, clarified and streamlined the Student Handout. I have also updated and clarified the Teacher Notes and added four appendices with optional sections for the Student Handout.
Ingrid
2018 revision
This learning activity has been entirely revised, although the same principles are covered. The first four sections of the revised Student Handout focus on understanding two phenomena: food poisoning and recovery of endangered species (e.g. whooping cranes). To understand these phenomena, students develop and investigate the exponential and logistic population growth models. Then, students investigate why these population growth models cannot account for many observed population trends, e.g. the decline in whooping crane populations that resulted in their endangered status. In a new final section, students apply what they have learned to a brief analysis of human population growth.
2017 revision
To engage student interest, the Student Handout begins with an analysis of characteristics of food poisoning that are related to population growth. To help students develop better understanding, I have revised and added questions and figures and reorganized the Student Handout. Revisions of the Teacher Notes include more explicit incorporation of NGSS Crosscutting Concepts.
Rabbits and genetic variability
re: "Rabbits can also show exponential population growth. A female cottontail rabbit begins reproducing by one year of age and typically has 3-4 litters of 4-5 baby rabbits each breeding season. A cottontail rabbit can live up to 8 years in captivity. If a population begins with a pair of breeding adults, and the rabbits have maximum reproduction and survival, how many rabbits do you think there would be after six years (just guessing, without calculating)?"
Why is it that the rabbits' offspring can interbreed with little or no mutation? Is there enough genetic variability so that the offspring from the first pair of rabbits are able to successfully produce healthy offspring?
Perils of Inbreeding
Thank you for your interesting comment which makes an important point. In fact, inbreeding rabbits in the way proposed would be expected to result in substantial problems. Breeding advice for rabbits often suggests various types of close inbreeding (e.g. parent/offspring, which is called "linebreeding"); however, this advice emphasizes the importance of culling any offspring which have inherited defects.
It is interesting that the huge population of rabbits in Australia is believed to be descendents of an initial group of 24 wild rabbits. This suggests that this small population had sufficient genetic variability to produce a very healthy population, although there may well have been additional introductions of rabbits since 1859. Also, of course, natural selection accomplished the recommended culling.
Your comment and these observations suggest another point that would be useful to include in the discussion of the last question in the section on Exponential Population Growth about unrealistic assumptions in the hypothesized rabbit population example.
2014 revisions
Some of the questions in the Student Handout have been revised and reorganized to improve clarity, and a question on density-dependent vs. density-independent effects on population growth has been added. The Teacher Notes have been substantially expanded to include more background information and explanation, as well as additional links to related learning activities for teaching ecology.
Post new comment